I knew this headline would grab you attention.
The S&P 500 closed out the month of February today with a small loss, but for the entire month the index was able to gain 1.1%. This has the index up for the month of January and February in the same year for the 26th time since 1945.
Every single time the index has been able to accomplish this feat the S&P 500 closed the year in positive territory. Through two months the S&P 500 is up 6.2%, so it does have a buffer below it in the event it is down from now through the end of the year.
The key is that the average gain during the 26 years the S&P 500 was up in January and February was 24%. If the index follows history and closed up 24% it would have the S&P 500 finishing the year at 1768 - a gain of almost 17% from the current closing price of 1514.

Market expert and TV personality Matt McCall blogs about what is really moving the markets. He will emphasize Exchange-Traded Funds (ETFs) and individual stocks throughout the trading day.
Thursday, February 28, 2013
3 ETFs to Hedge Inflation
Inflation may not be an issue if you listen to the government and their numbers. But as the person in my household that pays the bills and does the grocery shopping I know there is inflation already living among us.
Not only is there inflation now in the price of energy (see gas prices) and food (see milk prices), but it is clear that prices overall have been increasing. The big concern in the coming years is that inflation finally starts to hit at the level the government measures and that will hit our wallets even harder.
There are a number of different angles investors can take to prepare their portfolios for higher inflation in the future. They range from inflation-protected bonds to gold to timber. I have a sizable list of inflation hedges and today I will share 3 ETFs that fit the bill.
- PowerShares Senior Loan Portfolio ETF ($BKLN) - A basket of loans offered by banks to companies that are often rated below investment grade. This allows for a solid dividend (currently 4%) and because they are floating instruments it will not be hurt nearly as bad by rising interest rates.
- Guggenheim ABC High Dividend ETF ($ABCS) - The ETF invests in 3 commodity-rich countries (Australia, Brazil, and Canada) and chooses 30 of the highest yielding companies. This is an inflation play as typically commodity stocks will outperform during inflationary periods. And add in the 6.7% dividend the ETF currently pays it only increases the reward potential.
- iShares S&P Global Timber & Forestry ETF ($WOOD) - The timber/forestry/land stocks have historically done well during inflationary times and this basket of 27 stocks will give investors exposure to that sector. Additionally the sector should do well when the overall economy and market is moving upward as it is now.
Morning Market Video
Morning Market Update
Topics Covered: S&P 500, morning news, ETFs (Financials, Timber, Defense, Social Media, Indonesia, and Commodities).
Wednesday, February 27, 2013
Bullish Sign - Packaging Stocks
There are numerous ways to determine if the economy is doing well. One is the performance of the stock market. However, there can be a disconnect between the two as the market is often a leading indicator.
Withing the stock market I find certain sectors to be good indicators at the underlying strength of the true economy. One such sector is the Packaging & Container stocks. The chart below is the performance over the last year of the sector and as you can see it is near an all-time high it hit last week and today it is up 1%.

A couple upgrades today have the sector on the rise Owens Illinois ($OI) and Rock-Tenn Co. ($RKT). Both stocks trade with PEG ratios near 1.0, making them attractive fundamentally and both have very strong charts. If you believe in the global economic rebound you may want to check out the 2 companies.
Transport ETF Rallies Behind Rails
The iShares Dow Jones Transportation ETF ($IYT) is up 2.5% in early trading today on the back of a big move by the Railroad stocks. Leading the way is Kansas City Southern ($KSU) with a gain of 7.5%, pushing the ETF to a new all-time high.
The Dow Jones US Railroads Index is also closing in on an all-time high, suggesting to me the economy cannot be as bad any many believe considering the importance of moving goods on the rails.
The two rail stocks with the most attractive PEG ratios and charts are:
The Dow Jones US Railroads Index is also closing in on an all-time high, suggesting to me the economy cannot be as bad any many believe considering the importance of moving goods on the rails.
The two rail stocks with the most attractive PEG ratios and charts are:
- Genesee & Wyoming ($GWR) - PEG of 1.08
- Union Pacific ($UNP) - PEG of 0.99
Talking EU and Austerity on Real News
My view on the Eurozone and Austerity last night on "Real News" on The Blaze TV.
Friday, February 22, 2013
Two High Dividend ETFs to Watch
Nearly everyone loves ETFs and stocks that pay big dividends, but they also want the ability to join in a market rally and capital appreciation.
It is not easy to find the combination of high income and capital appreciation in a low yield environment like we have today, but it is possible. I am going to share 2 ETFs with you that fall into that category.
It is not easy to find the combination of high income and capital appreciation in a low yield environment like we have today, but it is possible. I am going to share 2 ETFs with you that fall into that category.
- E-Tracs Business Development Company ETN ($BDCS) - A basket of 28 stocks that will lend to small and medium sized private companies at above-average interest rates. They may also take stakes in the companies they lend to from time to time. The current yield on the ETN is 7.4%, which is very attractive and it was able to gain 23.6% in 2012, easily beating the S&P 500.
- IQ US Real Estate Small Cap ETF ($ROOF) - A basket of 48 real estate investment trusts (REITs) that give investors exposure to the small-cap portion of the sector. The current yield is 6.5% and in 2012 the ETF was up a whopping 30%.
Thursday, February 21, 2013
Our Best Performers Today
I always find it fascinating to look at the best performers on a day when the market takes a hit and the sellers are overwhelming the buyers. I broke down our lists of stocks/ETFs and will share the best performers of each group with about 40 minutes left in the trading day.
- ETF BULLETIN: SPDR Gold ETF ($GLD) was last up 0.7% and is bouncing after taking a beating the last two weeks.
- PFG HOLDINGS: AMN Healthcare ($AHS) was up 3.4% and close to a multi-year high.
- SINGLE COUNTRY ETFS: iShares MSCI Philippines ETF ($EPHE) down 0.2% but still the best performer of the small group of single-country ETFs.
- PFG WATCHLIST: Ultrapar Participacoes SA ($UGP) up 3.6% to a new all-time high for the Brazilian energy company.
- SECTOR ETFS: Market Vectors Gold Miners ETF ($GDX) up 1.9% is rising with gold and bouncing off a multi-year low.
- DOW INDUSTRIALS: Hewlett-Packard ($HPQ) up 2.7% as it continues to consolidate between $16 and $17.50.
- S&P 500: Safeway ($SWY) is surging 14.1% to a fresh one-year high.
- S&P 600 SMALL-CAP: Ciber ($CBR) is up 16.8% leading the small-cap stocks.
Do Not Panic - Take Two
The market is in the midst of a pullback from a multi-year high it
touched just 48 hours ago. When the S&P 500 closed Tuesday on the
high of the day at 1530, it was the best level since November 2007. The
headlines were bullish and investors were racing to get into stocks.
Wednesday saw the S&P 500 log its worst day of 2013 as it fell 1.3%. By midday Thursday the index was down another 0.7%, wiping out the gains of the last two weeks. In total the S&P 500 is 2% from the highest level since 2007.
The theme the last couple of weeks is that the market was due for a pullback of about 5% because it had the best January in two decades and stocks were ahead of themselves. So here it is!
But instead of being patient and letting the market enjoy a healthy pullback, investors will panic and the pundits will begin to call the "top of the market" as they have been doing for the last year. Yes, eventually they will be correct and a bigger sell-off will occur, however trying to pick the top is as difficult as it is to pick a bottom in the market.
My point I am trying to get across is that nearly every investor was searching for a pullback in the market to put more money to work and now that it is happening the same investors are running for the exits. I will sit here patiently and look to put client's money to work when I feel the selling is slowing and the market is on support and will actually buy into weakness - what a novel concept!
Wednesday, February 20, 2013
Benefits of an Income Portfolio
Today the market took a drubbing as it logged its worst one-day session of 2013. The SPDR S&P 500 ETF ($SPY) was down 1.3% after hitting a multi-year high yesterday.
It was one of the days where it was difficult to find any green on the screen. Gold fell, oil fell, the Euro fell, even some of the safe havens were not able to hold early gains.
So this is when I turn our ETF Income Portfolio in our ETF Bulletin newsletter. The portfolio of 10 ETFs that is 100% invested in the market only fell by 0.5% as the broad market lost 1.3%. The outperformance is not surprising considering the makeup of the portfolio.
What I am trying to get at is that there are a large number of investors reading this that would like to have the benefits of a regular income stream and at the same time some protection from big market sell-offs. If you fall into this category you need to consider our ETF Income Portfolio strategy we offer through my company, Penn Financial Group.
And to give you an idea of how the portfolio has done in a bull market, since June 8 of last year the S&P 500 is up 14.0% and the ETF Income Portfolio is up 10.8%. So even during strong bull markets the portfolio has proven to hold its own.
For more information on building an Income Portfolio that fits your needs please call the office at 1-877-383-7366 or email info@pennfinancialgroup.com.
Income Stocks Yielding Over 7%
In a world of low interest rates and a volatile stock market it is no surprise that investors have been searching out high yielding stocks to compensate for low yielding bonds.
With the 10-year Treasury yielding 2% it is barely keeping up with inflation. And when rates start to move higher in the coming years the 2% you are locked in at becomes even more unattractive. This is only one reason to stay away from US Treasury bonds.
It is time to think outside the box. We have built an all-ETF Income Portfolio as part of our ETF Bulletin newsletter service. It is currently yielding over 6% and is up over 10% since June of last year!
We also work with individual stocks and there are a handful out there that yield over 7% and I wanted to share a few with you. (** Investors must remember with such high dividend yields there is elevated risk.)
- Seadrill ($SDRL) - Dividend Yield 8.9%. The oil equipment company and driller has been consolidating lately and could be set to rebound.
- TICC Capital Corp ($TICC) - Dividend Yield 11.0%. A business development company that invests primarily in technology-related companies via loans.
- Rentech Nitrogen Partners ($RNF) - Dividend Yield 7.1%. Produces nitrogen fertilizers and other agricultural chemicals.
Friday, February 15, 2013
Asia-Pacific ETF Yielding Over 5%
When investors think about Asia-Pacific investing the first thing that comes to their mind is China.
Well yes China is a behemoth in the world today, but there are other countries in the region that are often overlooked and this could be detrimental to an investors portfolio. On country/continent in the region is Australia - how many investors have exposure to Australia?
By adding some Australian investments to your portfolio you not only further diversify a portfolio, but also could potentially increase reward potential. There is the iShares Australia ETF ($EWA), which hit a new 18-month high today for direct exposure. However, I prefer to diversify even further AND want to add some yield to the portfolio.
This is why I am highlighting the iShares Asia/Pacific Dividend ETF ($DVYA). The ETF is a basket of 31 high-yielding stocks in the region. Australia makes up 46% of the ETF, followed by Singapore 19%, Hong Kong 13%, Japan 12%, and New Zealand 10%.
The current 30-day SEC yield on the ETF is 5.2% and it charges an expense ratio of 0.49%.
Year-to-date the ETF is up 5%, not including any dividends paid.
The top holdings are Telecom Corp of New Zealand, Metcash, and National Australia Bank. The ETF is composed mainly of financials, telecom, consumer staples, and industrials.
Here is a chart of the ETF over the last 6 months.

Thursday, February 14, 2013

More Bullish Housing News - Time to Buy?
Realtor.com reported today that the housing inventory fell by 5.6% month-over-month in January and is down 16.5% from one year ago. This puts the total inventory at the lowest level in 11 years.
In a separate report, RealtyTrac showed foreclosures falling by 11% in January and they are down 28% from last January.
The reports show 2 bright spots. A drop in inventory even if met with stagnant demand should lead to higher home prices based on simple economics. Then there is the fall in foreclosures that will help remove the homes exchanges hands and below market values. The combination of the two reports show the continued bottoming process in the nationwide housing market.
Is it time to buy into the housing stocks?
We had recommended the iShares Home Construction ETF ($ITB) a few months ago in our ETF Bulletin and it is up over 40% and one of our big winners!
I still see more upside in the housing sector with ETFs and stocks. Also more upside in certain REITs.
A stock I discussed in a blog post yesterday ($SBY) may be one to watch.
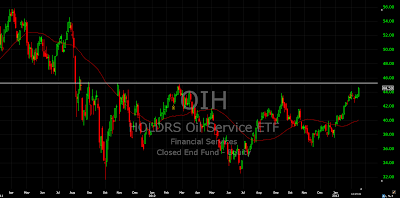
ETF of the Day - Oil Service
The HOLDRS Oil Service ETF ($OIH) is up 2.2% today and is rallying to the best level since last February. The rally today has the ETF at a level that has been a significant area of resistance in the past and the next couple of weeks will be important for the entire sector.
The ETF is a basket of 26 stocks involved in the oil service sector. The top three holdings are Schlumberger ($SLB), Halliburton ($HAL), and National Oilwell Varco ($NOV). They make up a 39% of the ETF; a high concentration for the top holdings and potentially a concern for investors.
The expense ratio is 0.35% and the year-to-date return is an impressive 15.5%.
As the search for oil expands to deep water offshore sites and the shale boom around the globe continues it bodes well for the stocks in this sector.
Below is a chart of the ETF over the last 2 years and it shows how it has continually failed to break out of the $45 area. When the ETF finally breaks above the resistance level it will be significant because it will trigger a buy signal. Techincally speaking the breakout will be out of an Inverse Head and Shoulders Pattern - which is Very Bullish.
My opinion at this time is to hold and if $OIH can breakout, look to initiate a new position.

Gold Could Surge on China News
The FT is reporting today that China is likely to to launch its first ETF backed by physical gold at some point this year. According to the World Gold Council (and most people who follow the metals), this will provide a big boost to demand for the yellow metal.
Investment demand for gold fell for the first time last year since 2007. The launch of the aforementioned gold ETFs would be welcomed by gold bugs that have been frustrated with the recent movement in the metal. The SPDR Gold ETF ($GLD) is up 4.5% since the start of 2012 and is lagging the overall stock market.
We continue to hold $GLD for clients and our original purchases were in 2006. Therefore we have large gains in the ETF and continue to hold at this time, but the charts are becoming more bearish as of late. The news out today is one major reason to hold or start to look to build positions if you have been looking for an entry point.
Wednesday, February 13, 2013
Favorite Stocks on Support
The market is near highs, but there are always stocks that pullback on their own to support and offer opportunities, here 4 I find intriguing.
- Seadrill ($SDRL) -The offshore services company offers rigs and other products to the energy industry. The stock also pays a 8.8% dividend yield. Trying to hold support between $37 and $38.
- Alliance Data ($ADS) - Company provides loyalty and market solutions to a variety of industries and trades with an attractive PEG Ratio of 1.03. Stock is finding support between $150 and $152.
- Facebook ($FB) - We all know what this company does; techincally it is finding support at $27 and may have started the rebound today.
- American Vanguard ($AVD) - The chemical company that primarily deals with agricultural chemicals trades with a low PEG Ratio of 0.86 and rallied 4% off support at the $32 area.
Profiting from Foreclosures
How does this scenario sound to you??
Buying a foreclosed single family home, renovate the home, and rent it out to bring in monthly income. That sounds great to me, but unfortunately I cannot hang a picture correctly. The other issue is the amount of money you must have to get started initially. And assuming you have that money, it could be tied up for years.
So how can we profit from this strategy without laying out large amounts of money and/or learning how to rip down walls.
Let me introduce you to Silver Bay Trust ($SBY). The company was recently spun off from Two Harbors ($TWO) and owns thousands of single family homes and it rents out about 80% of the homes in an effort to generate rental income. Along with income there is the potential for capital appreciation of the homes.
The stock began trading in mid-December and is expected to register as a REIT, which will force it to distribute the majority of its income to shareholders. If this is the case I would expect $SBY to pay an above-average dividend.
More to come on $SBY in the future and if any clients or newsletter subscribers have questions on $SBY feel free to email me at info@pennfinancialgroup.com.

Tuesday, February 12, 2013
3 ETFs for the State of the Union
President Obama will make his 5th State of the Union address tonight and the word is that he will place a lot of focus on the economy. And more specifically jobs.
So how could the SOTU affect the market and specific sectors?
Here is a breakdown of 3 ETFs that could benefit from the Obama SOTU.
So how could the SOTU affect the market and specific sectors?
Here is a breakdown of 3 ETFs that could benefit from the Obama SOTU.
- Guggenheim Solar ETF ($TAN) - A basket of solar stocks could get a boost as Obama is expected to about boosting jobs in clean energy. This topic will also be brought up when the climate is surely mentioned.
- iShares S&P Global Infrastructure ETF ($IGF) - One of Obama's ways of creating more jobs and at the same time doing a much needed upgrade on our bridges and roads is through infrastructure stimulus.
- SPDRs Industrial ETF ($XLI) - As manufacturing continues to struggle in the US, Obama will push to rebound the industry. The stocks that make up $XLI could be beneficiaries of such a strategy.
Monday, February 11, 2013
Investment Ideas from CNN Appearance
After taping a segment with Christine Romans this past week that was scheduled to air on "Your Bottomline" on Saturday morning I found out the show was cancelled due to storm coverage, which makes perfect sense.
BUT, since the work was done, why not share with you some of the highlights. Here are some of the questions and my answers.
How high can the market go?
Based on earnings of $110/share for the S&P 500 and a P/E ratio of 15 that puts the index at 1650. This is a 9% increase from current levels and and new all-time high for the index.
Where are the best opportunities?
If the market continues the current uptrend I see opportunities in the high beta (riskier) sectors. The financials, airlines, emerging markets, and technology. At the same time some of the sectors I have been overweight I continue to like: high dividend stocks, REITs, and energy.
Where should we avoid?
Anything and everything dealing with US Treasury bonds (interest rates will increase hurting US Treasury bonds). Also underweight utilities and consumer staples.
Other reasons to be bullish?
Low interest rates (artificially held down by the Fed), below average valuations, and the retail investor under invested. The market will continue to climb the "wall of worry"; once sentiment is extremely bullish it will be time to sell. Investors must also learn to ignore headline risk (Greece, Debt Ceiling, China Slowing, etc.), because each situation has been a buying opportunity rather than a reason to sell.
Monday Investment Ideas
It is a rainy and dreary day in Manhattan and as I sift through hundreds of stocks/ETFs my day is getting brighter as I come across some exciting new investment ideas.
Because it always makes you feel better to share happiness I have decided to share 1 stock and 1 ETF from the list I have put together today with my followers.
Northern Tier Energy LP ($NTI) - This MLP began trading last year and has been under the radar for most investors. The stock is up another 3% today and hitting a new high as it extends its winning streak to 12 sessions. A pullback is in order, please do not chase the stock at current levels. The number that jumps out at you is the current dividend yield based on the one dividend payment it has made - 20.4% yield!! This makes the stock even riskier because if that yield falls it could make for a wild ride for $NTI. Please proceed with caution, but I wanted to share this stock because it has been flying under the radar.
Market Vectors Indonesia ETF ($IDX) - The southeast Asian country is one of the most populous in the world and its stock market has been extremely impressive. The ETF is breaking out today to the best level since May of last year and it is looking stronger than its geographical peers. If the ETF can hold above the $29-$29.50 area it will be a bullish technical signal for the country and enough to issue a buy alert on the ETF.
2 Emerging Market Niche ETFs
With a large amount of money flowing into emerging market ETFs in January I felt it was appropriate to highlight the sector for our followers.
The most popular emerging markets ETF is the iShares MSCI Emerging Markets Index ETF ($EEM). This ETF has been around for over a decade and has often been the go-to ETF for investors looking to gain exposure to the emerging markets. The one problem I have with $EEM is that it concentrates almost solely the large-cap emerging market stocks and therefore does not give true exposure to the sector.
I would like to focus on 2 Niche Emerging Market ETFs that could help diversify a portfolio and boost gains.
EG Shares Emerging Markets High Income Low Beta ETF ($HILO) - The ETF invests in emerging market stocks that will offer lower volatility along with a higher dividend yield than the MSCI Index ($EEM). The ETF pays a 5.2% dividend yield, well above that of 1.7% offered by $EEM. The top countries are South Africa, Turkey, and China. Financials and consumer goods are the top sectors. In the last 18 months the ETF is up 6% versus a 6% gain for $EEM, but when the dividend is taken into consideration $HILO has clearly outperformed.
EG Shares Emerging Markets Consumer ETF ($ECON) -This niche ETF concentrates on companies that sell to the consumer within the emerging market countries. The sectors include food and beverage, retailers, media, and autos. This ETF has big upside in our opinion because of the potential for the middle class to continue outperforming the overall emerging markets sector. In the last 18 months the ETF is up 23% - blowing the doors off the return of $EEM.
Chart of $ECON vs. $EEM over the last 12 months.

** We owns shares of $HILO and $ECON for clients of Penn Financial Group.
Thursday, February 7, 2013
Matt on CNN this Weekend
I will be on CNN this weekend at 9:30am et on "Your Bottomline" with Christine Romans discussing the market rally and if it it too late to buy into stocks today
You will get me in-depth view of the markets and a few stock/ETF ideas that may surprise you.
Tune into CNN during the 30-minute show for all my thoughts.
Thanks for watching!
You will get me in-depth view of the markets and a few stock/ETF ideas that may surprise you.
Tune into CNN during the 30-minute show for all my thoughts.
Thanks for watching!
Do Not Panic - This is a Bull Market
It always amazes me how investors can go from long-term bullish on the market to bearish in a matter of 48 hours. The Dow is within 2% of an all-time high and the S&P 500 is less than 5% from the same feat, yet investors are concerned a bear market is upon us.
First of all look at the situation from the flipside. How hard is it to call the bottom in the market? When the market is 2% from a multi-year low there are always bulls saying it is time to buy, but at the same time that philosophy is also saying stick you neck out try to pick a market bottom. The same can be said for investors fighting the 4-year uptrend and are trying to pick the top of the market.
Back to today. Just yesterday the S&P 500 closed one point below the best closing level in over four years. Today the market is down a whopping 0.5% as of 12:45et and it must be the end of the road for the bull market and owning stocks!!
If you have been following me for years you will know by now I like pullbacks in the market, especially during uptrends. It allows investors to enter at "discounted" prices. After the best January in two decades do you think it would be a surprise if stocks pull back in the early part of February? NO! Therefore let the market pullback as it needs to do and when your ETFs/Stocks hit the levels you want to buy them at - hit the buy button.
Below is a look at the chart of the SPDRs S&P 500 ETF ($SPY) that tracks the aforementioned index. The horizontal white line is price support and the red line is the 50-day moving average. The two indicators are very important support for the ETF and any pullback should remain above the two lines. The white line is at the $148 area, which from current levels is a 1.7% pullback. From the high the pullback would total 2.5%. Both numbers are very small pullbacks in the grand scheme of things and investors should welcome the weakness as an opportunity to buy into solid ETFs/Stocks.

Wednesday, February 6, 2013
What we Bought this Week
During the first three days of the week the market has dropped big time, rallied back, and once again is giving ground. With the indices within striking distance of new highs the trend remains to the upside and I want to look to buy into new stocks/ETFs on pullbacks.
We issued 2 buy alerts for subscribers of The ETF Bulletin newsletter. One was an ETF that yields 7.4% annually and is up 3% so far this year. The ETF is not popular and the "flying under the radar" status is something we appreciate for our subscribers.
The second buy recommendation was for the Rotation Portfolio; this ETF gives investors exposure to a niche sector with the technology industry. The stocks in this niche have started to turn bullish in the last few months and we felt it was time to take a flyer on this high beta ETF.
We also bought 2 new stocks for our clients at PFG in the last 3 days: a specialty paper company and a high-flying social media stock.
I do feel there could be some more short-term weakness in the overall market, but want to use any pullbacks as buying opportunities into solid long-term plays.
For more on the services Penn Financial Group offers to individual investors please feel free to email us at info@pennfinancialgroup or call the office at 1-877-383-7366.
ETFs to play Japan at 4-Year High
The Nikkei in Tokyo surged by 3.8% last night and closed at a fresh 4-year high as the news of BOJ Governor Shirakawa leaving early sent the Yen lower and stocks higher. The thought-process is that more "easing" from the BOJ is bad for the Yen and good for the Japanese stock market. So far that thinking has paid off for investors.
Japan ETFs
The Rydex CurrencyShares Japanese Yen ETF ($FXY) is down 17% since mid-September 2012 and this morning will break to the lowest level since 2009. We once owned this for clients as a "hedge" and it did really well and we made good money. Thankfully we sold well before the recent slide.
The iShares Japan ETF ($EWJ) is up 9% in the last 6 months, but has yet to break out to a new 52-week high. This has to do with the fall of the Japanese Yen and currency conversion within the ETF.
The WisdomTree Japan Hedged Equity ETF ($DXJ) is up 29% in the last 6 months because the goal of the ETF is to provide exposure to the Japanese stock market while eliminating currency fluctuations between the Japanese Yen and the US Dollar. A weak Yen has been helpful to $DXJ and hurts $EWJ.
The iShares Japan Small Cap ETF ($SCJ) is only up 6% in the last 6 months as the small caps have lagged and once again the currency fluctuations (weak Yen) have hurt the overall performance.
Below is a 6 month chart of $DXJ versus $EWJ. The outperformance by $DXJ is very clear.

Updated View on Gold
As the stock market inches closer to an all-time high the once popular yellow metal, Gold, has fallen off the radar of many investors. The long-term believers of inflation and higher interest rates use Gold as a hedge against any future shocks. But the short-term traders may have given up on the metal as volatility has fallen.
The chart below shows the SPDR Gold ETF ($GLD) over the last year and as you can see in the last couple of months the ETF has been consolidating. The two white lines form a symmetrical triangle pattern that suggests the ETF will breakout in one direction and start a new trend in that direction.
The red and blue lines are the 50-day and 200-day moving averages, respectively. With both falling between the two white trend lines it is a true display of how important the next breakout or breakdown will be for GLD.
We continue to hold GLD for clients and will watch closely the developments over the next couple of weeks. Our educated guess is that GLD will break to the upside and start a new leg higher that will last a few months.

Monday, February 4, 2013
European ETFs Get Crushed
Amid reports of political corruption in Spain and more focus on the upcoming election in Italy, it send the European markets tumbling to their worst one-day loss in months.
The iShares Italy ETF ($EWI) is currently down 5.7%, wiping away all the gains from the month of January in one day. The iShares Spain ETF ($EWP) is down 4.9% and the ETF is now down 1.5% for the year.
The iShares S&P Europe 350 ($IEV), a basket of 350 large-cap European stocks is down 2.6% and is still up 3.0% for the year.
The uber-risky iShares Europe Financials ETF ($EUFN) is down 3.9%, but is still up 3.6% for the year. I like $EUFN for the next 12-18 months, but I would look to buy a little lower than the current price. Again, this is a risky play.
I would suggest not trying to jump in front of this bear train that is Europe today, but there will be a buying opportunity at some point in February.
Subscribe to:
Posts (Atom)